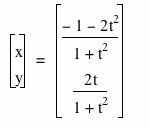

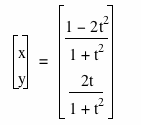
In this assignment I am going to give some examples for parametric functions.Here we have a parametric function such as below function :
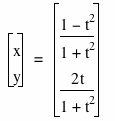
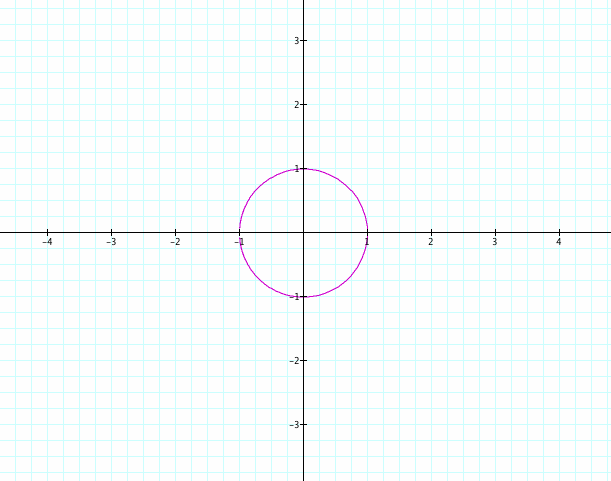
In this function -Π ≤ t ≤Π. If we plot the graph of this function then our graph will look like below graph:
As you can see our graph looks like unit circle except it doesn't connected at -1.

Here I changed the interval from -Π ≤ t ≤Π to -8Π ≤ t ≤8Π and plot it then as you understand from below graph, our graph come closer to -1 at x-axis.
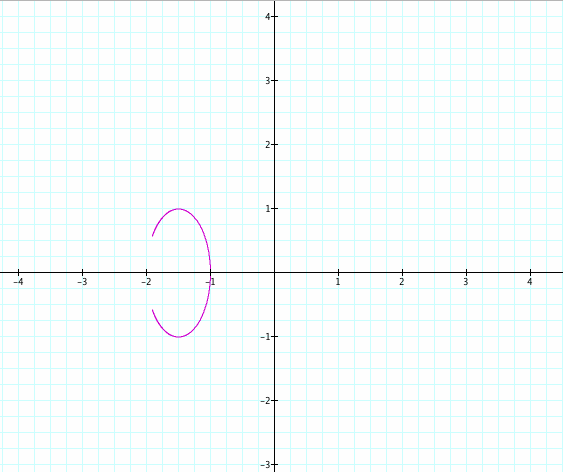
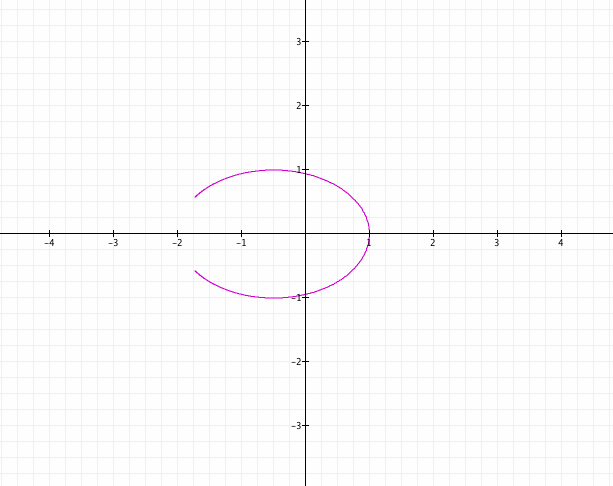
Now what happens if we we change -t² with -2t²? Our function going to be as below function and if we plot it then the graph takes an elliptical shape but again it doesn't connect at negative x-axis.
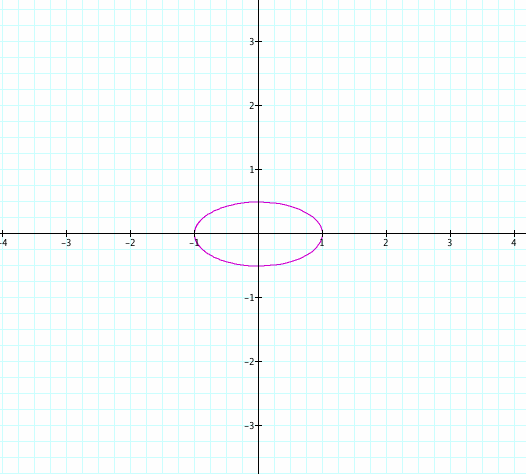
Now, what happens if we replace 2t with t in the y value and if t takes values between -8Π and 8Π ?
When we plot our function then as you can see our graph will look like an ellipse. Here we change y = 2t / 1+ t² to y = t / 1+ t² then the graph will take smaller values at y axis.
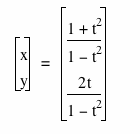
Here is a new parametric function. I replaced 1 + t² with 1 - t² in both x and y then when I plot it the graph shaped like X.
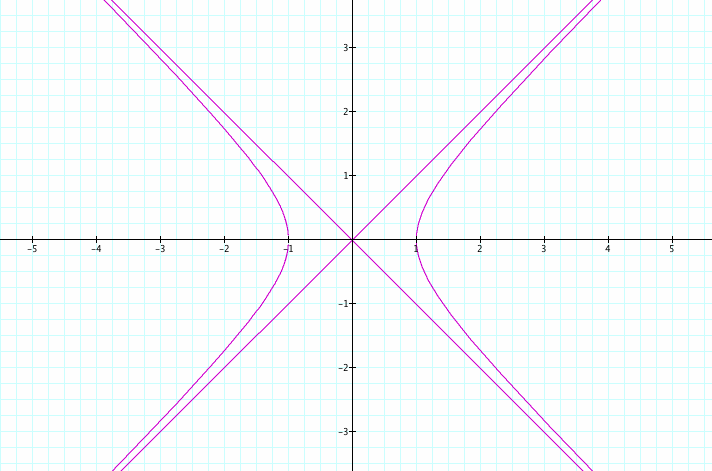
Above graph we have two lines and two parabolas. Two lines are as we can understand from graph y = x and y = -x. Parobolas intercept with x-axis at 1 and -1.
In the below function I replaced 1 with -1 in the x value then our graph switched from center to left.
